A Corollary to ExperimentCalculator.com (with examples)

Dan McKinley recently put together a very useful tool in estimating how long to run your A/B tests.
The obvious corollary here being, “your experiments will take much longer than you think”.
Let’s dive into some real-world numbers.
Adwords campaign optimization
The scenario. You’re buying clicks from Google Adwords to get people to sign up for your startup’s new service. You just made some copy changes to the landing page which you’re hoping will improve signup conversion. Your base signup rate is 10%, and you expect your new changes to increase signup rate to 15% (a +50% increase!). You spend $0.50 per click with a budget of $100 per day, so your landing pages see a total of 200 visits each day.
The statistics. You’d have to run this campaign for 8 days and spend $800 to verify the changes. Alternately, if conversion rate increased to only 11% (a +10% change), then you’d have to spend $15,000 to verify the change.
Ecommerce optimization (Etsy)
The scenario. During a company hack week, a designer makes several changes to the cart page and wants to run a 1% experiment. The designer is quite bullish about the changes and thinks that it could in fact boost sales by 5% (!), or about $50 million from 2013’s expected sales of over $1 billion.
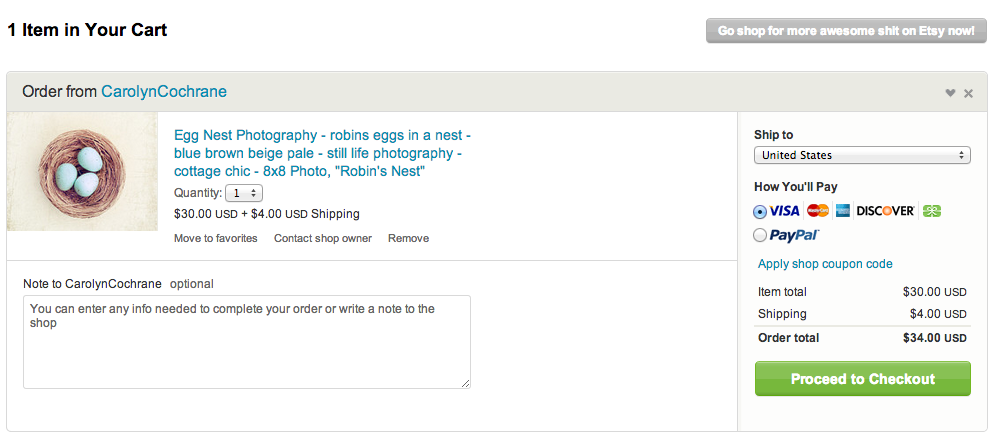
The statistics. According to their blog, Etsy sold over $100 million with of goods in April with almost 1.5 billion page views. Assuming standard e-commerce conversion rates of 4% (along with some other assumptions about average order size), this experiment would need to be run for over 3 years! An experiment affecting 10% of users would require only two weeks.
My last startup (Adtuitive)
The scenario. We bought relatively cheap display ads on niche content sites and matched sku-level ads from our database of millions of products. Depending on placement and sites, click rates for us were sometimes around 0.1% (which believe it or not was a huge improvement over static banner ads). We were serving around 200 million ads a month, and we were releasing an algorithmic change that we thought might increase click rates (and our revenue) by 10% (!).

As the change was somewhat major, we didn’t want to roll it out to more than 10% of visits during our experiment.
The statistics. We would have had to run the experiment for 39 days. Our 200 million ads per month equated to 3 million per day, or about 500k visits per day (visitors view multiple ads). Running it at 50% would have required only 7 days.
Takeaways
Calling bullshit. Next time someone claims they increased their landing page conversion from 10% to 15%, you may want to question things. Exactly how many conversions are they dealing with? And how many separate changes did they make? Small changes are also harder to measure than larger ones.
Google’s famed 1% experiments really only work at Google scale. You’ll have to run your experiments at 10% or 50% levels. And of course, make sure you double check your statistics.
Opportunity cost. Experiments take more than just design and software to code up, they also take time to run and verify. So before restyling the checkout button, ask yourself if there are other parts of your core funnels or product that you’d be better off testing first.
Other reasons to test. Sometimes changes are necessary to accommodate future functionality or new strategic changes for the overall product. E.g. restyling the cart page to provide more whitespace for a future gift cards launch, or revamping the homepage to give attention to some fledgling social aspects of your site. In these cases, even when you expect a 0% change (or even a negative change), testing is still important to understand impact. And of course, statistics still apply.
So, next time you're planning to run an experiment, you may want to spend some time with Mr. ExperimentCalculator.com first. Your intuition is most likely wrong.